Dealer Performance
Helping dealers see, and own, how they perform
Dealers on Motorway make fast decisions across bidding, buying and post-sale. But they had no clear view of how they were performing, and sellers had no way to tell a reliable dealer from an unreliable one.
I designed two connected products to change that. The Dealer Performance Dashboard showed dealers their own bidding, spending and cancellations in one place. Dealer Reviews then brought seller feedback into the same space, turning how dealers treat sellers into something visible, fair and worth improving.
I led design across both, from first research with dealers through to launch and the iterations that followed.
- Role
- Design Lead
- Product
- Dealer Dashboard & Reviews
- Platform
- Web desktop & mobile
- Focus
- Strategy, design & data
The problem
Dealers couldn't see how they were doing, and sellers couldn't see who to trust.
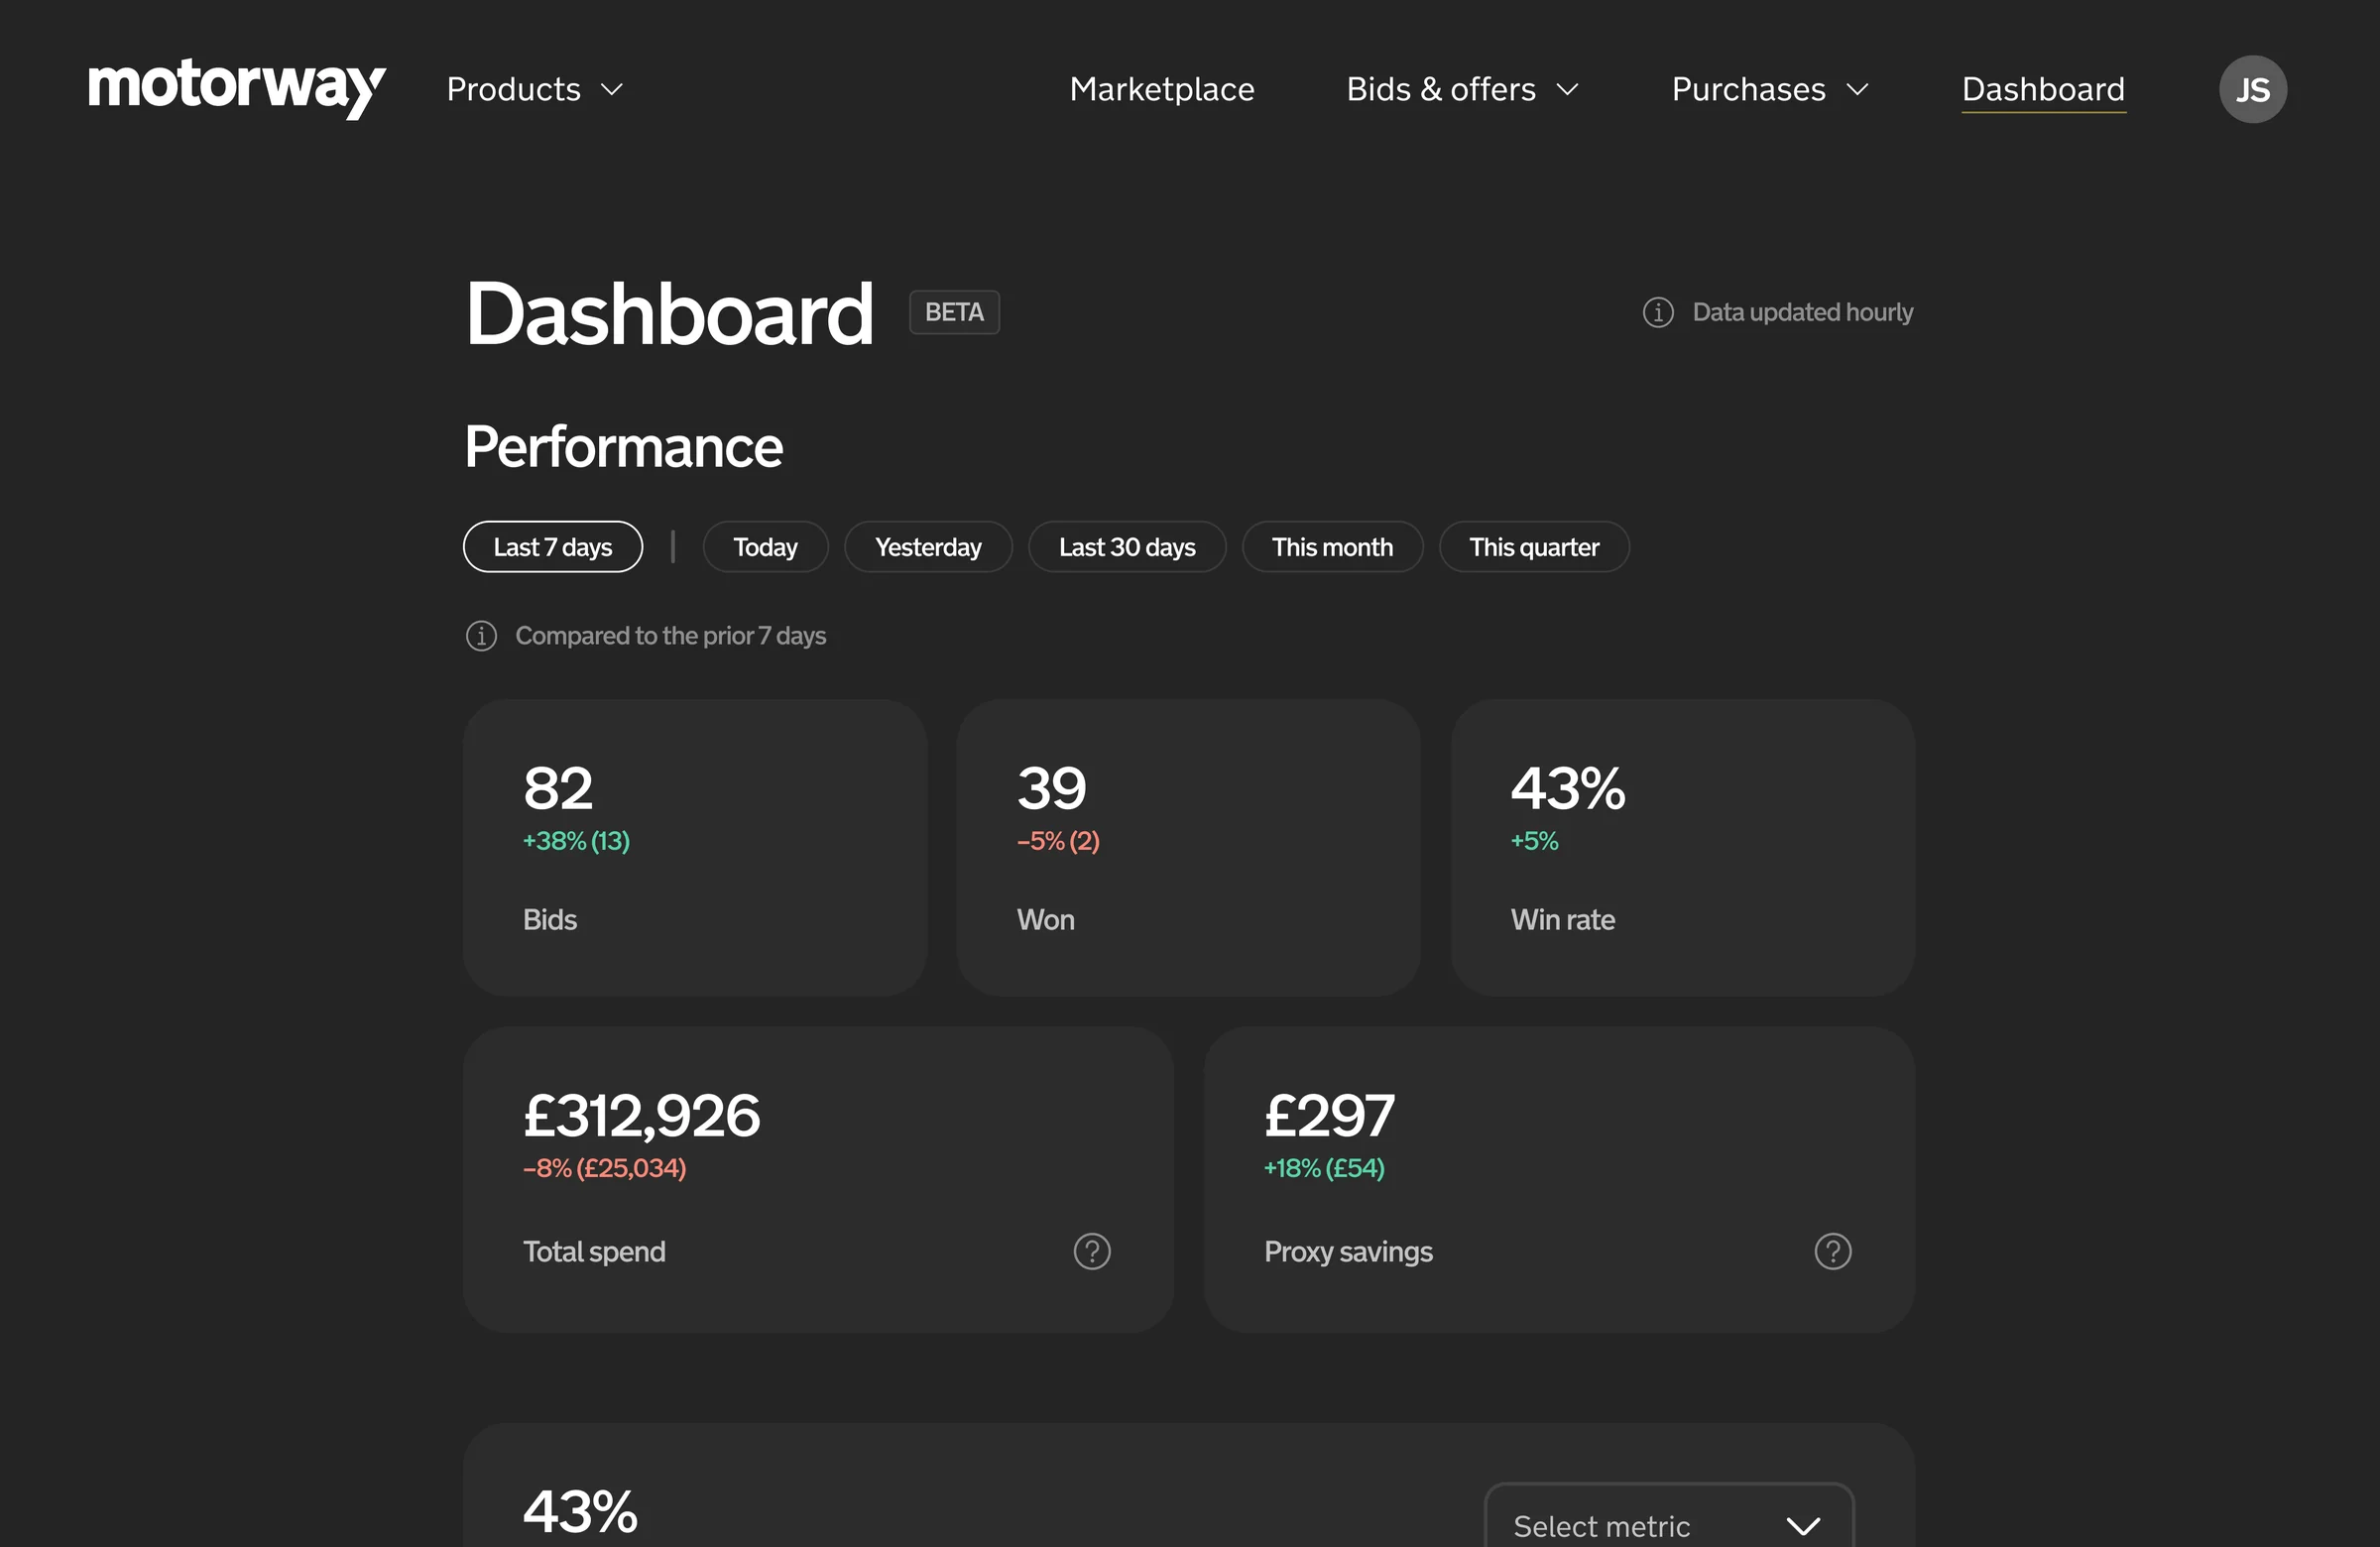
Motorway held a lot of data about dealer activity, but dealers couldn't easily see or interpret it: how well they were bidding, what they were spending or where cancellations were putting them at risk.
Sellers had the opposite gap. They could compare offers, but not how a dealer behaved after winning a car. Some dealers communicated well and honoured their bids; others cut prices at collection or cancelled. Yet they all competed on largely equal terms.
- Dealers needed a clear picture of their performance, and a way to stand out when they treated sellers well.
- Sellers had little to go on when judging a dealer before accepting an offer.
- Motorway relied on investigating problems after they had happened, rather than encouraging better behaviour up front.
Both problems came down to the same thing: performance that existed in the data but wasn't visible to the people who could act on it.
The solution
One place to see performance, then reputation alongside it.
We built it in two phases, each on top of the last.
1. The Dealer Performance Dashboard
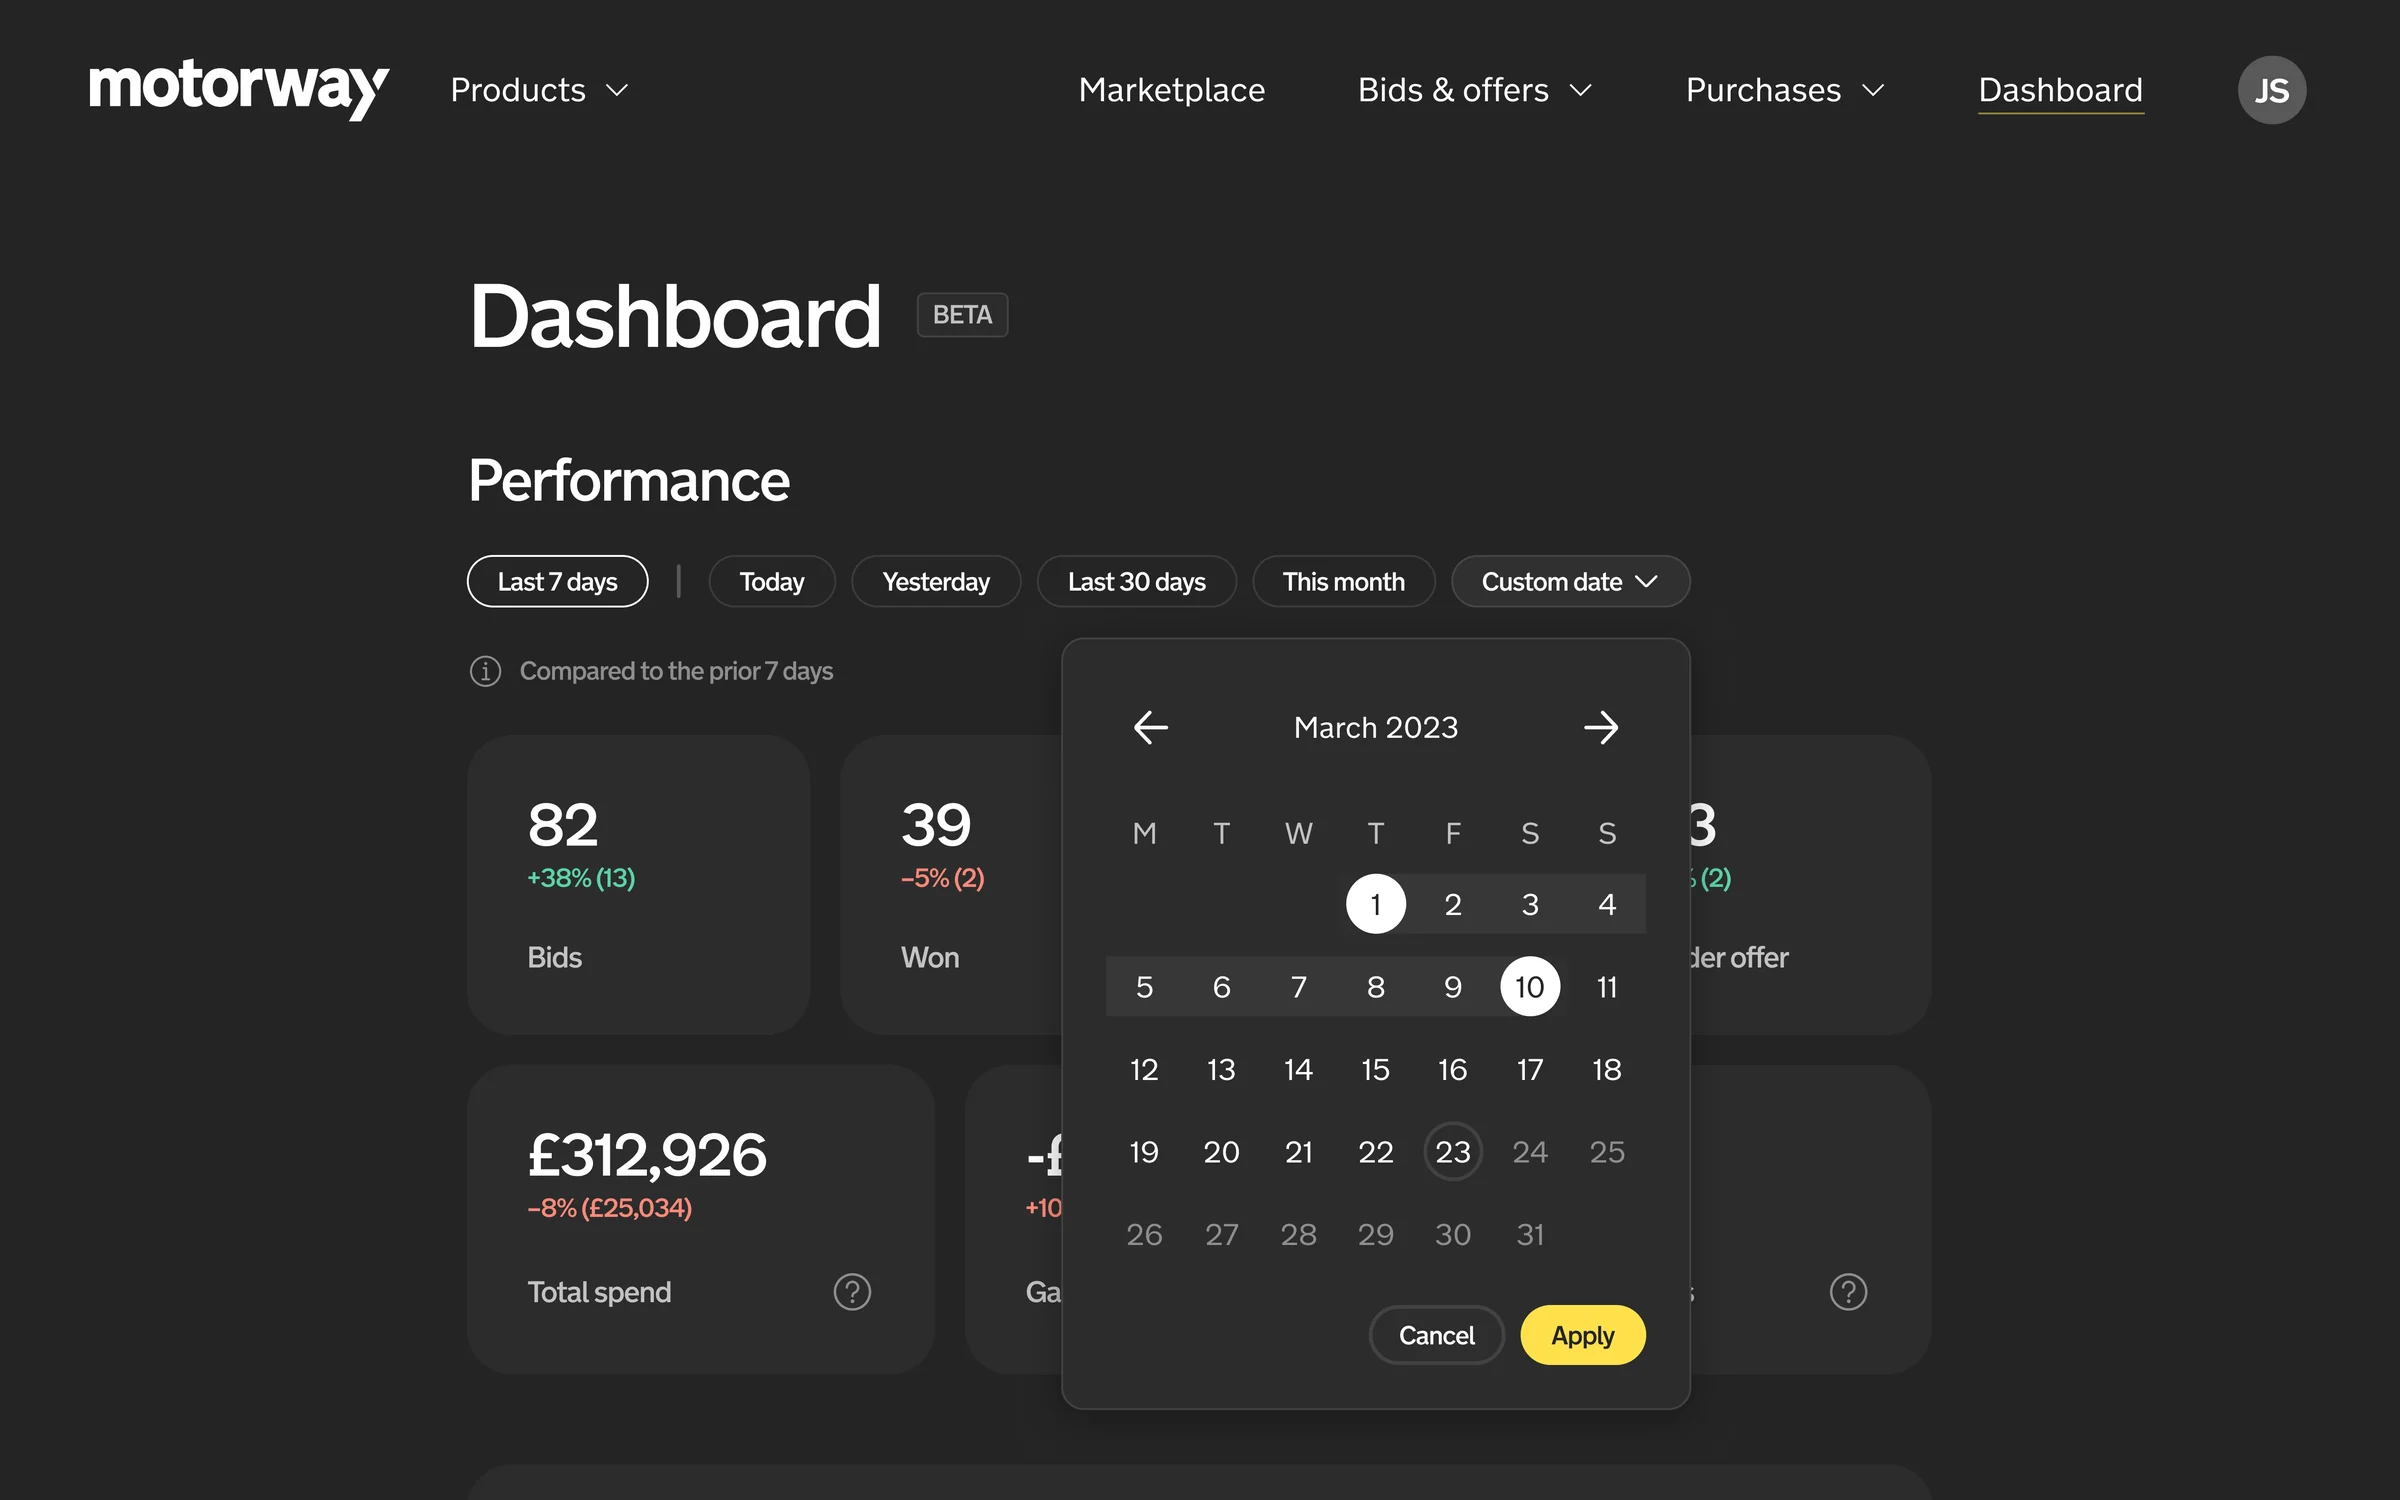
A dedicated space in Motorway Pro bringing headline metrics, historical trends and cancellations together. Dealers could see how their business was doing at a glance, explore the numbers over time and spot operational risks before they became problems.
2. Dealer Reviews
Seller reviews brought into the same dashboard, so dealers could see how sellers rated them, spot recurring issues and challenge feedback they thought was unfair. Rather than launching public ratings straight away, we showed dealers their own reviews first, then explored how reputation could help sellers choose.
The design & key decisions
Making performance easy to understand, and fair to be judged on.
01. Lead with the metrics dealers need most
Headline figures (bids, cars won, auction win rate, total spend and the gap to the winning bid) got a clear hierarchy above the detailed trends, so dealers could scan first and dig in where it mattered. Date ranges and trend charts showed how results changed, moving dealers from a single number to the story behind it.
02. Give cancellations their own space
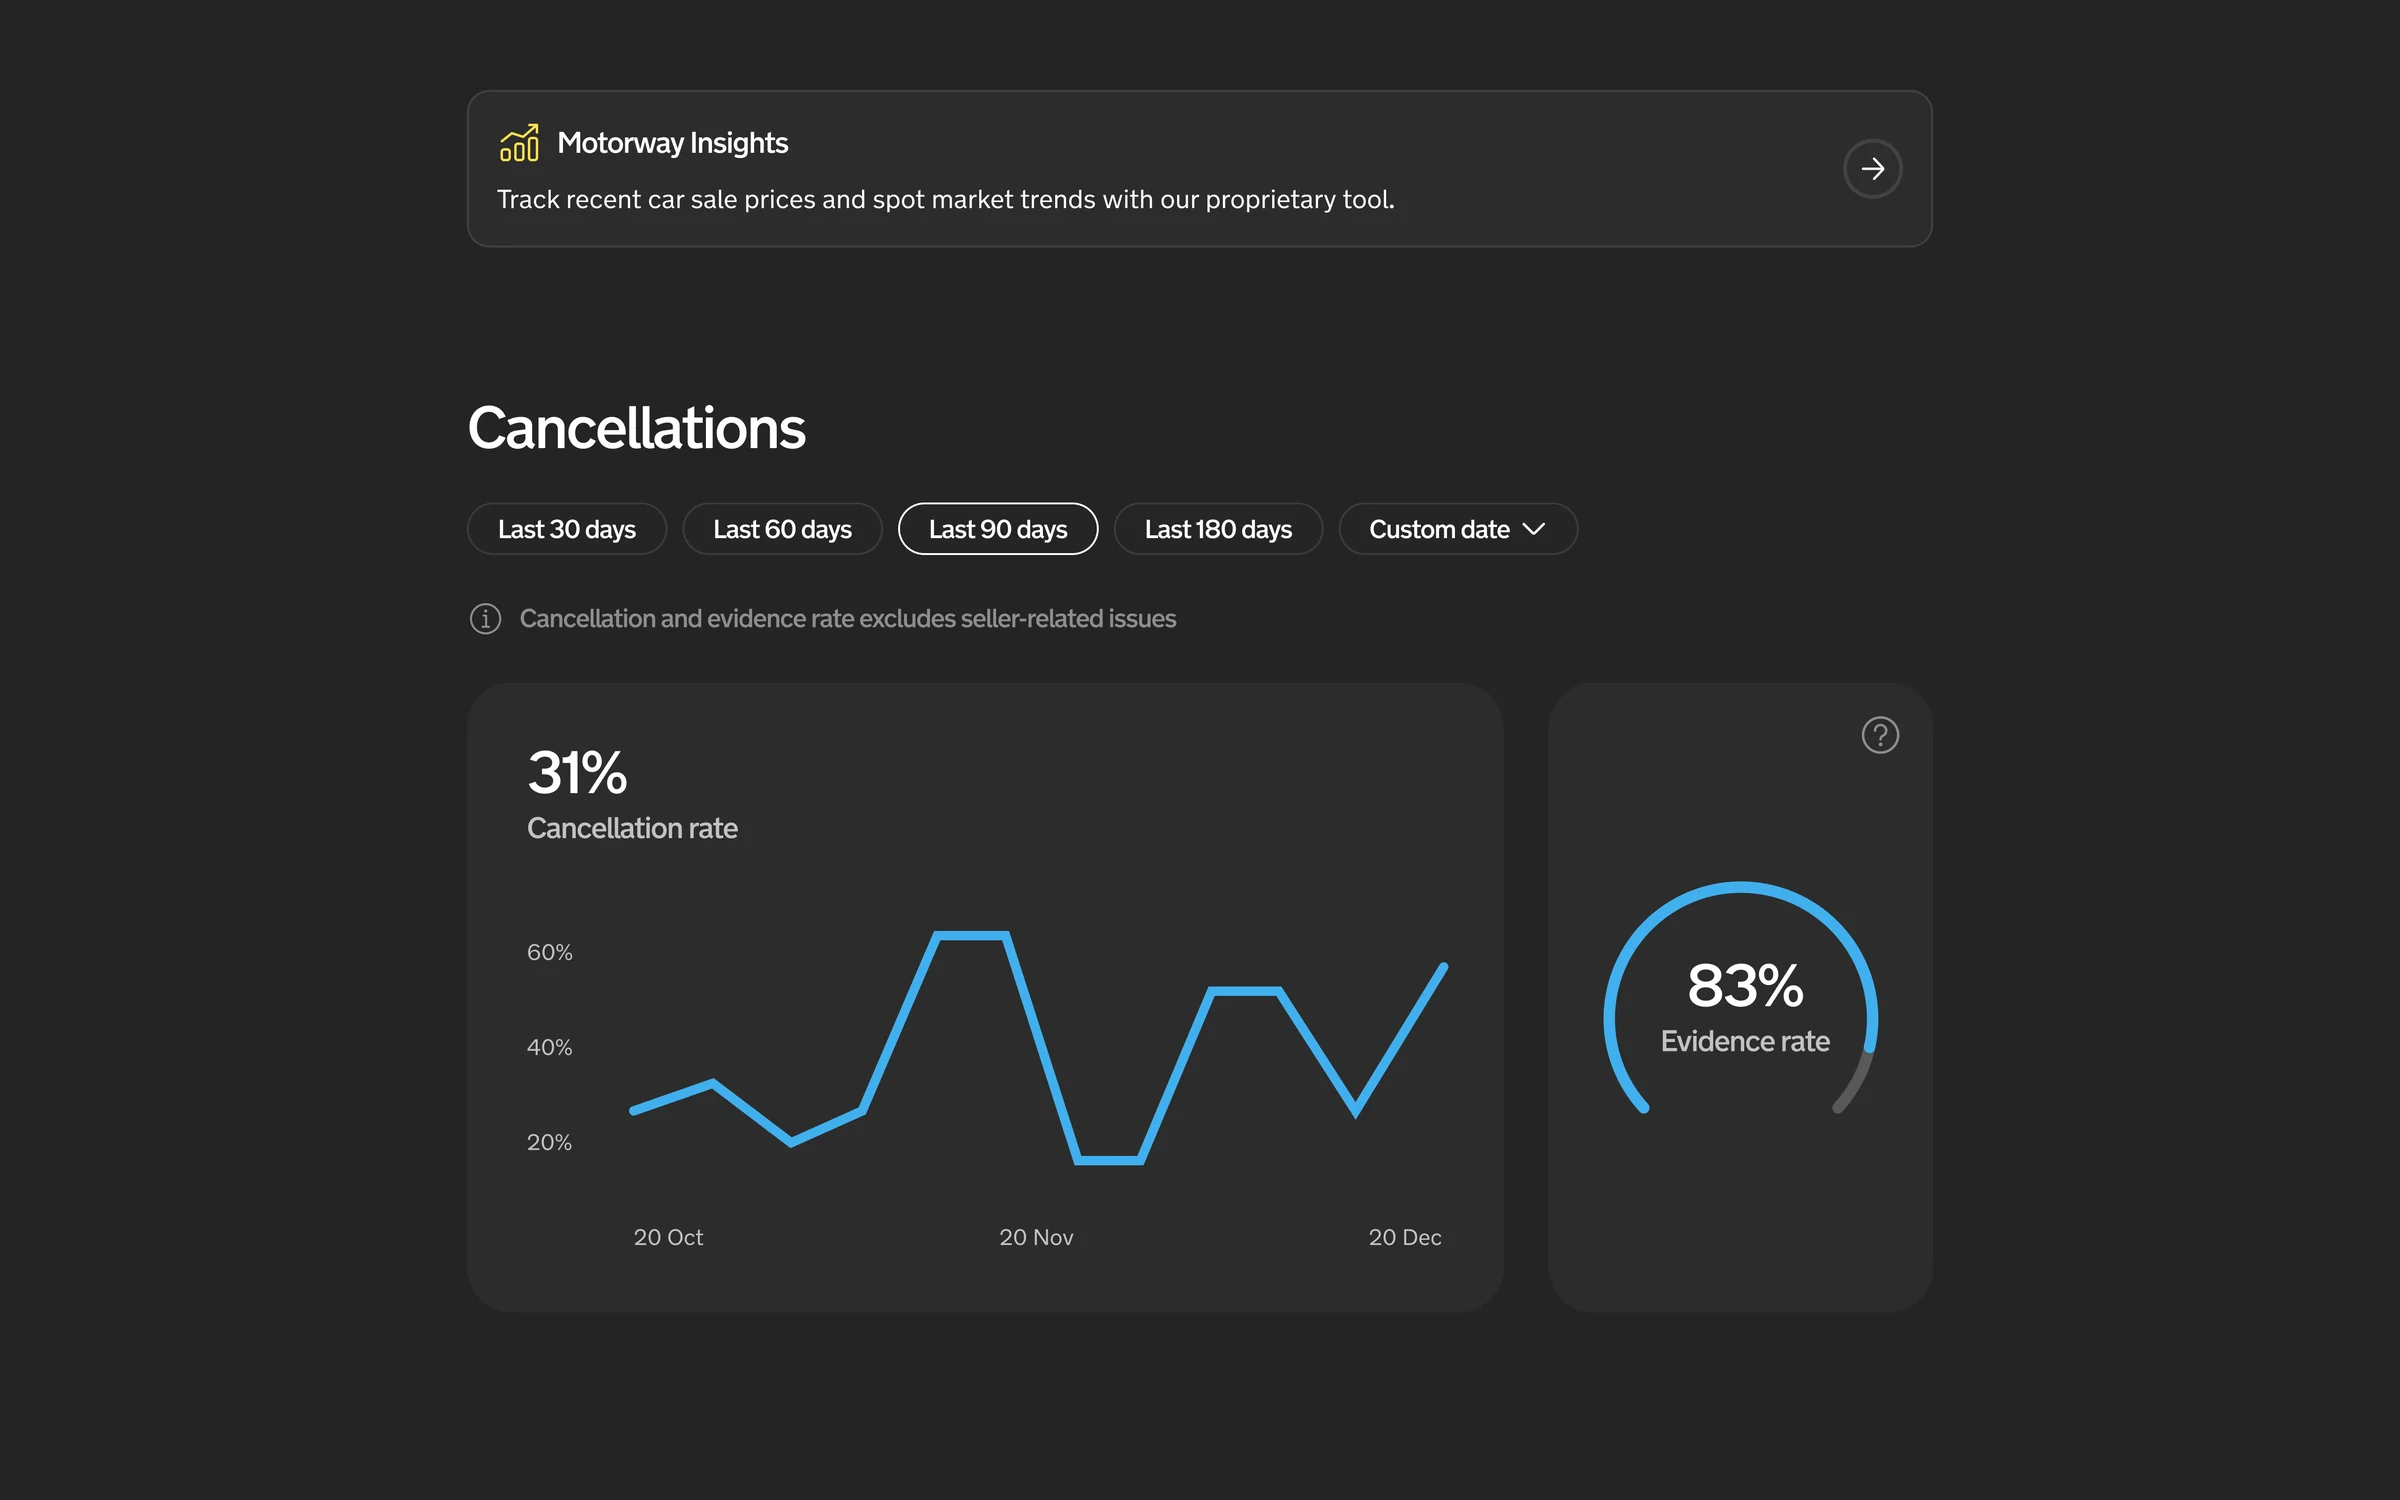
Cancellations are an operational risk, so they needed different treatment from general performance. The cancellations view combined rate trends, evidence rates and individual records, with guidance when a dealer's rate approached a threshold.
03. Put reviews where dealers already track performance
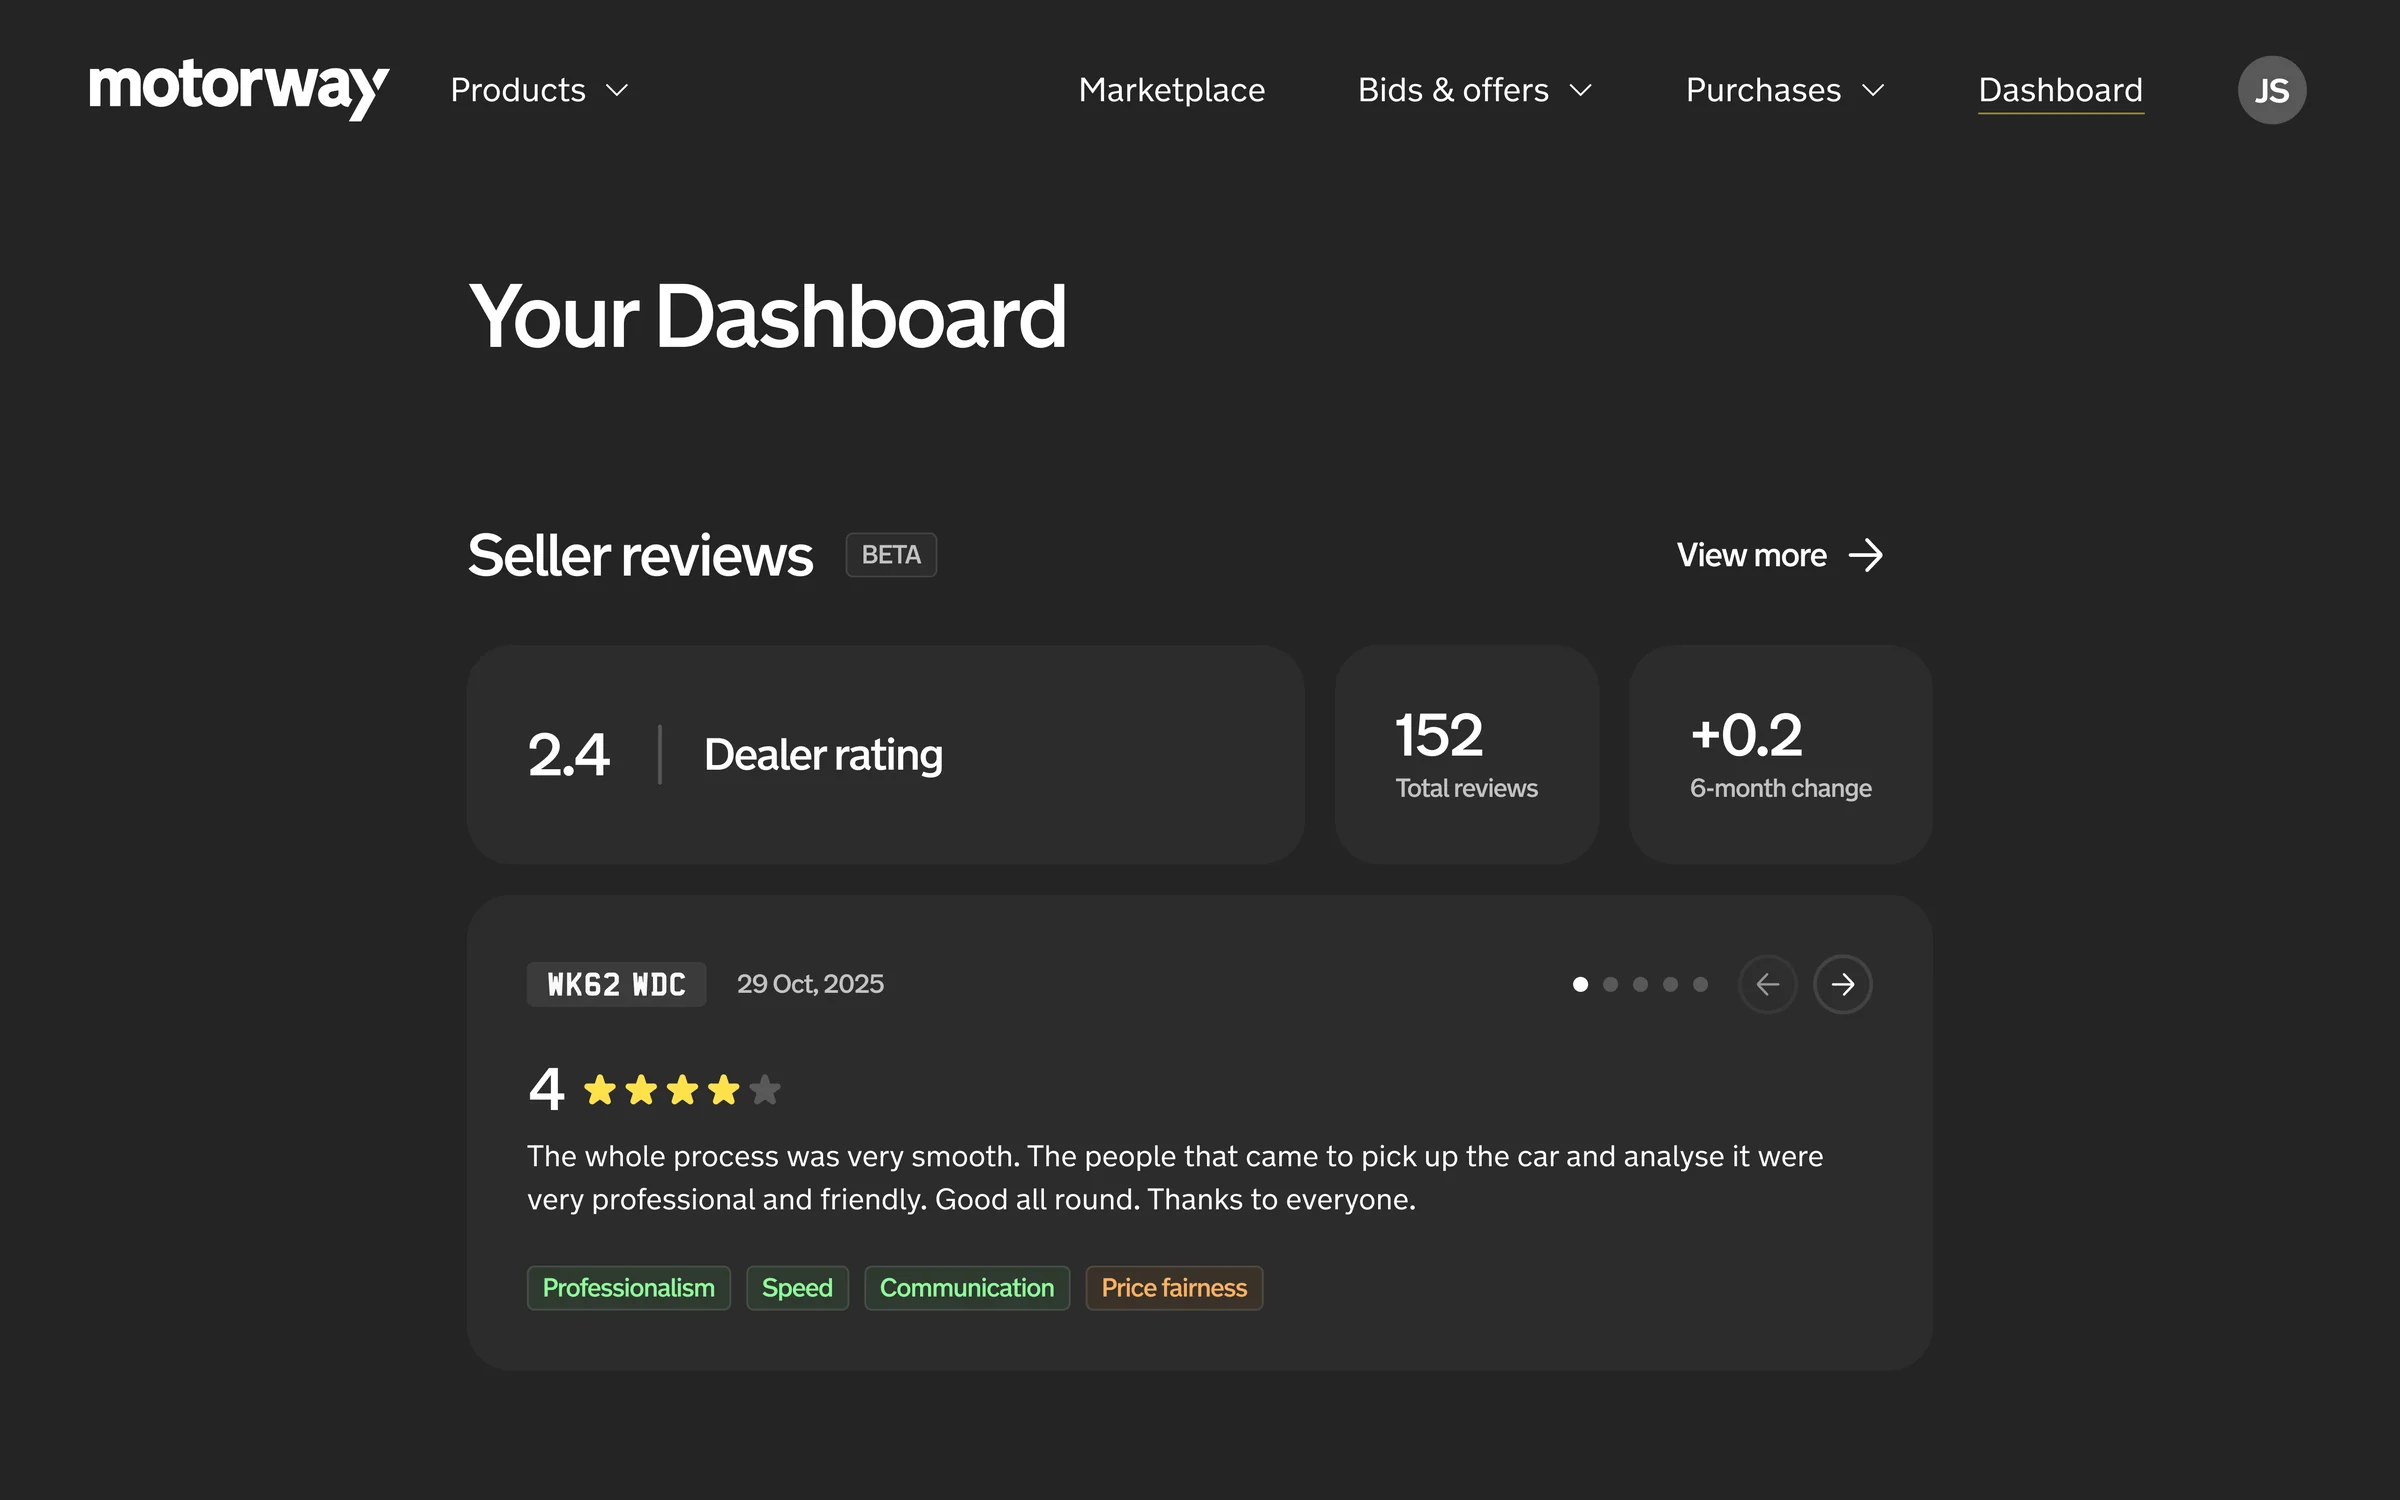
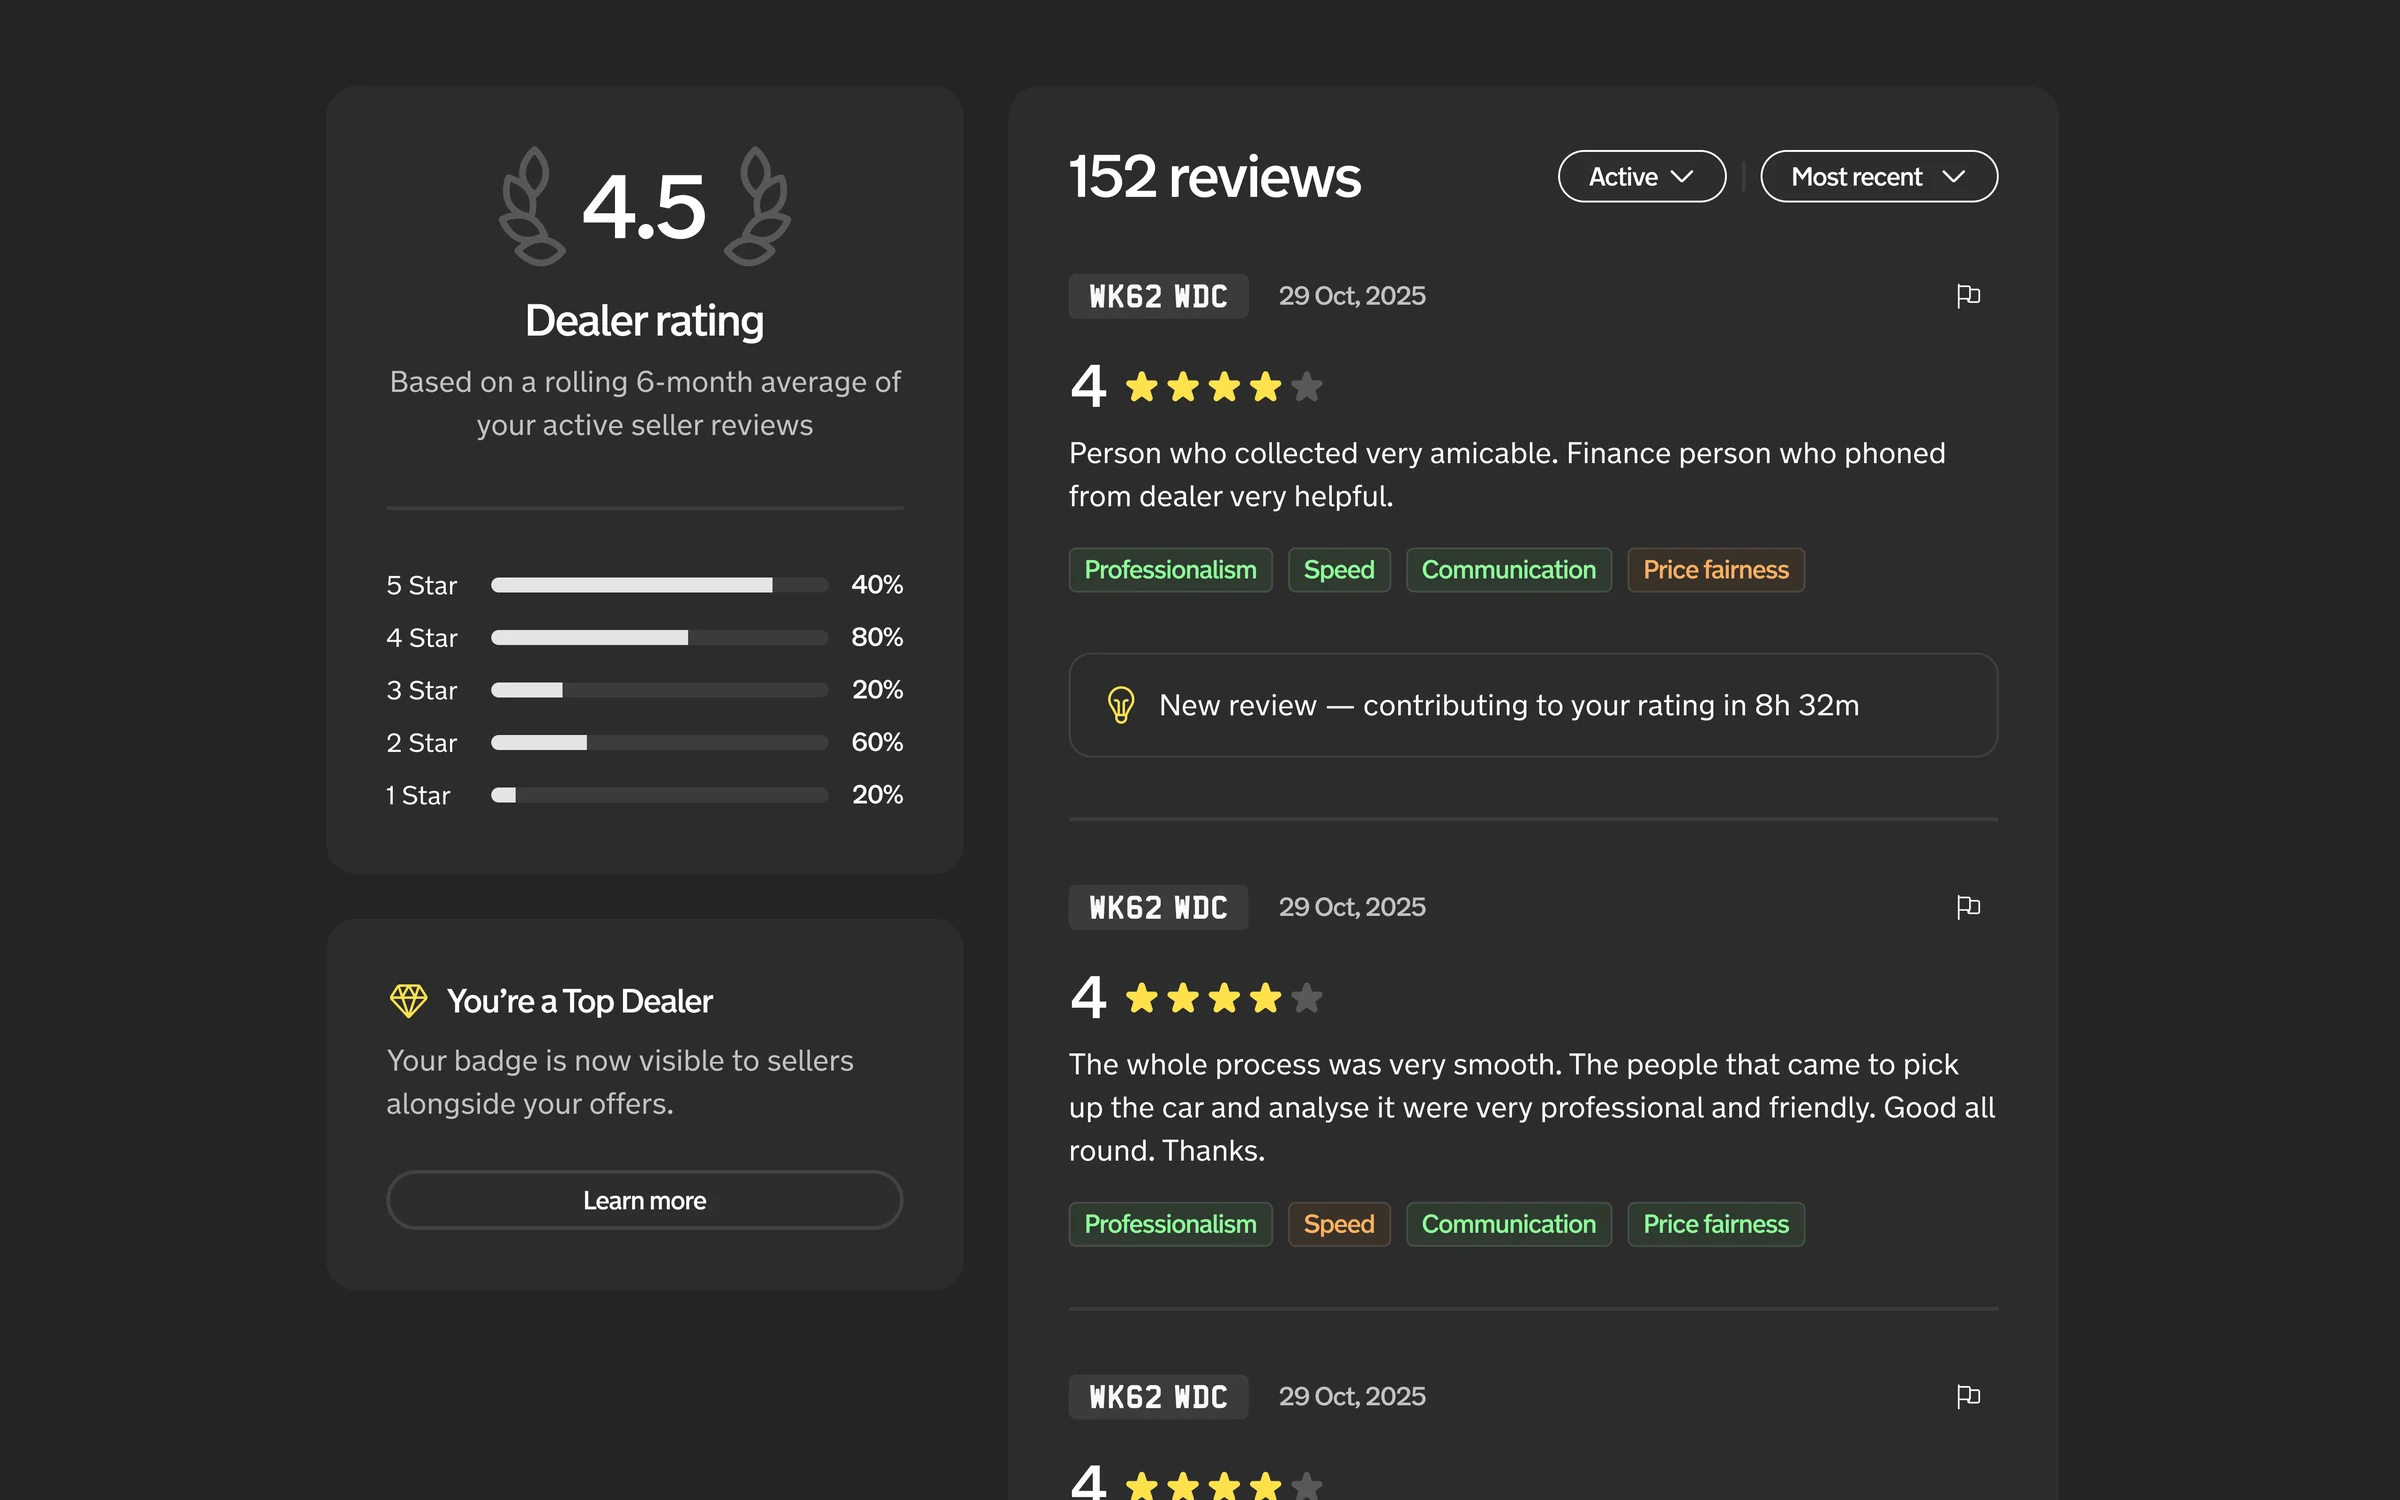
The dashboard was the natural home for reviews. Showing the spread of ratings alongside written feedback made the score explainable, and patterns around communication, professionalism and price fairness made reviews a tool for improving, not a verdict.
04. Design for fairness, not just transparency
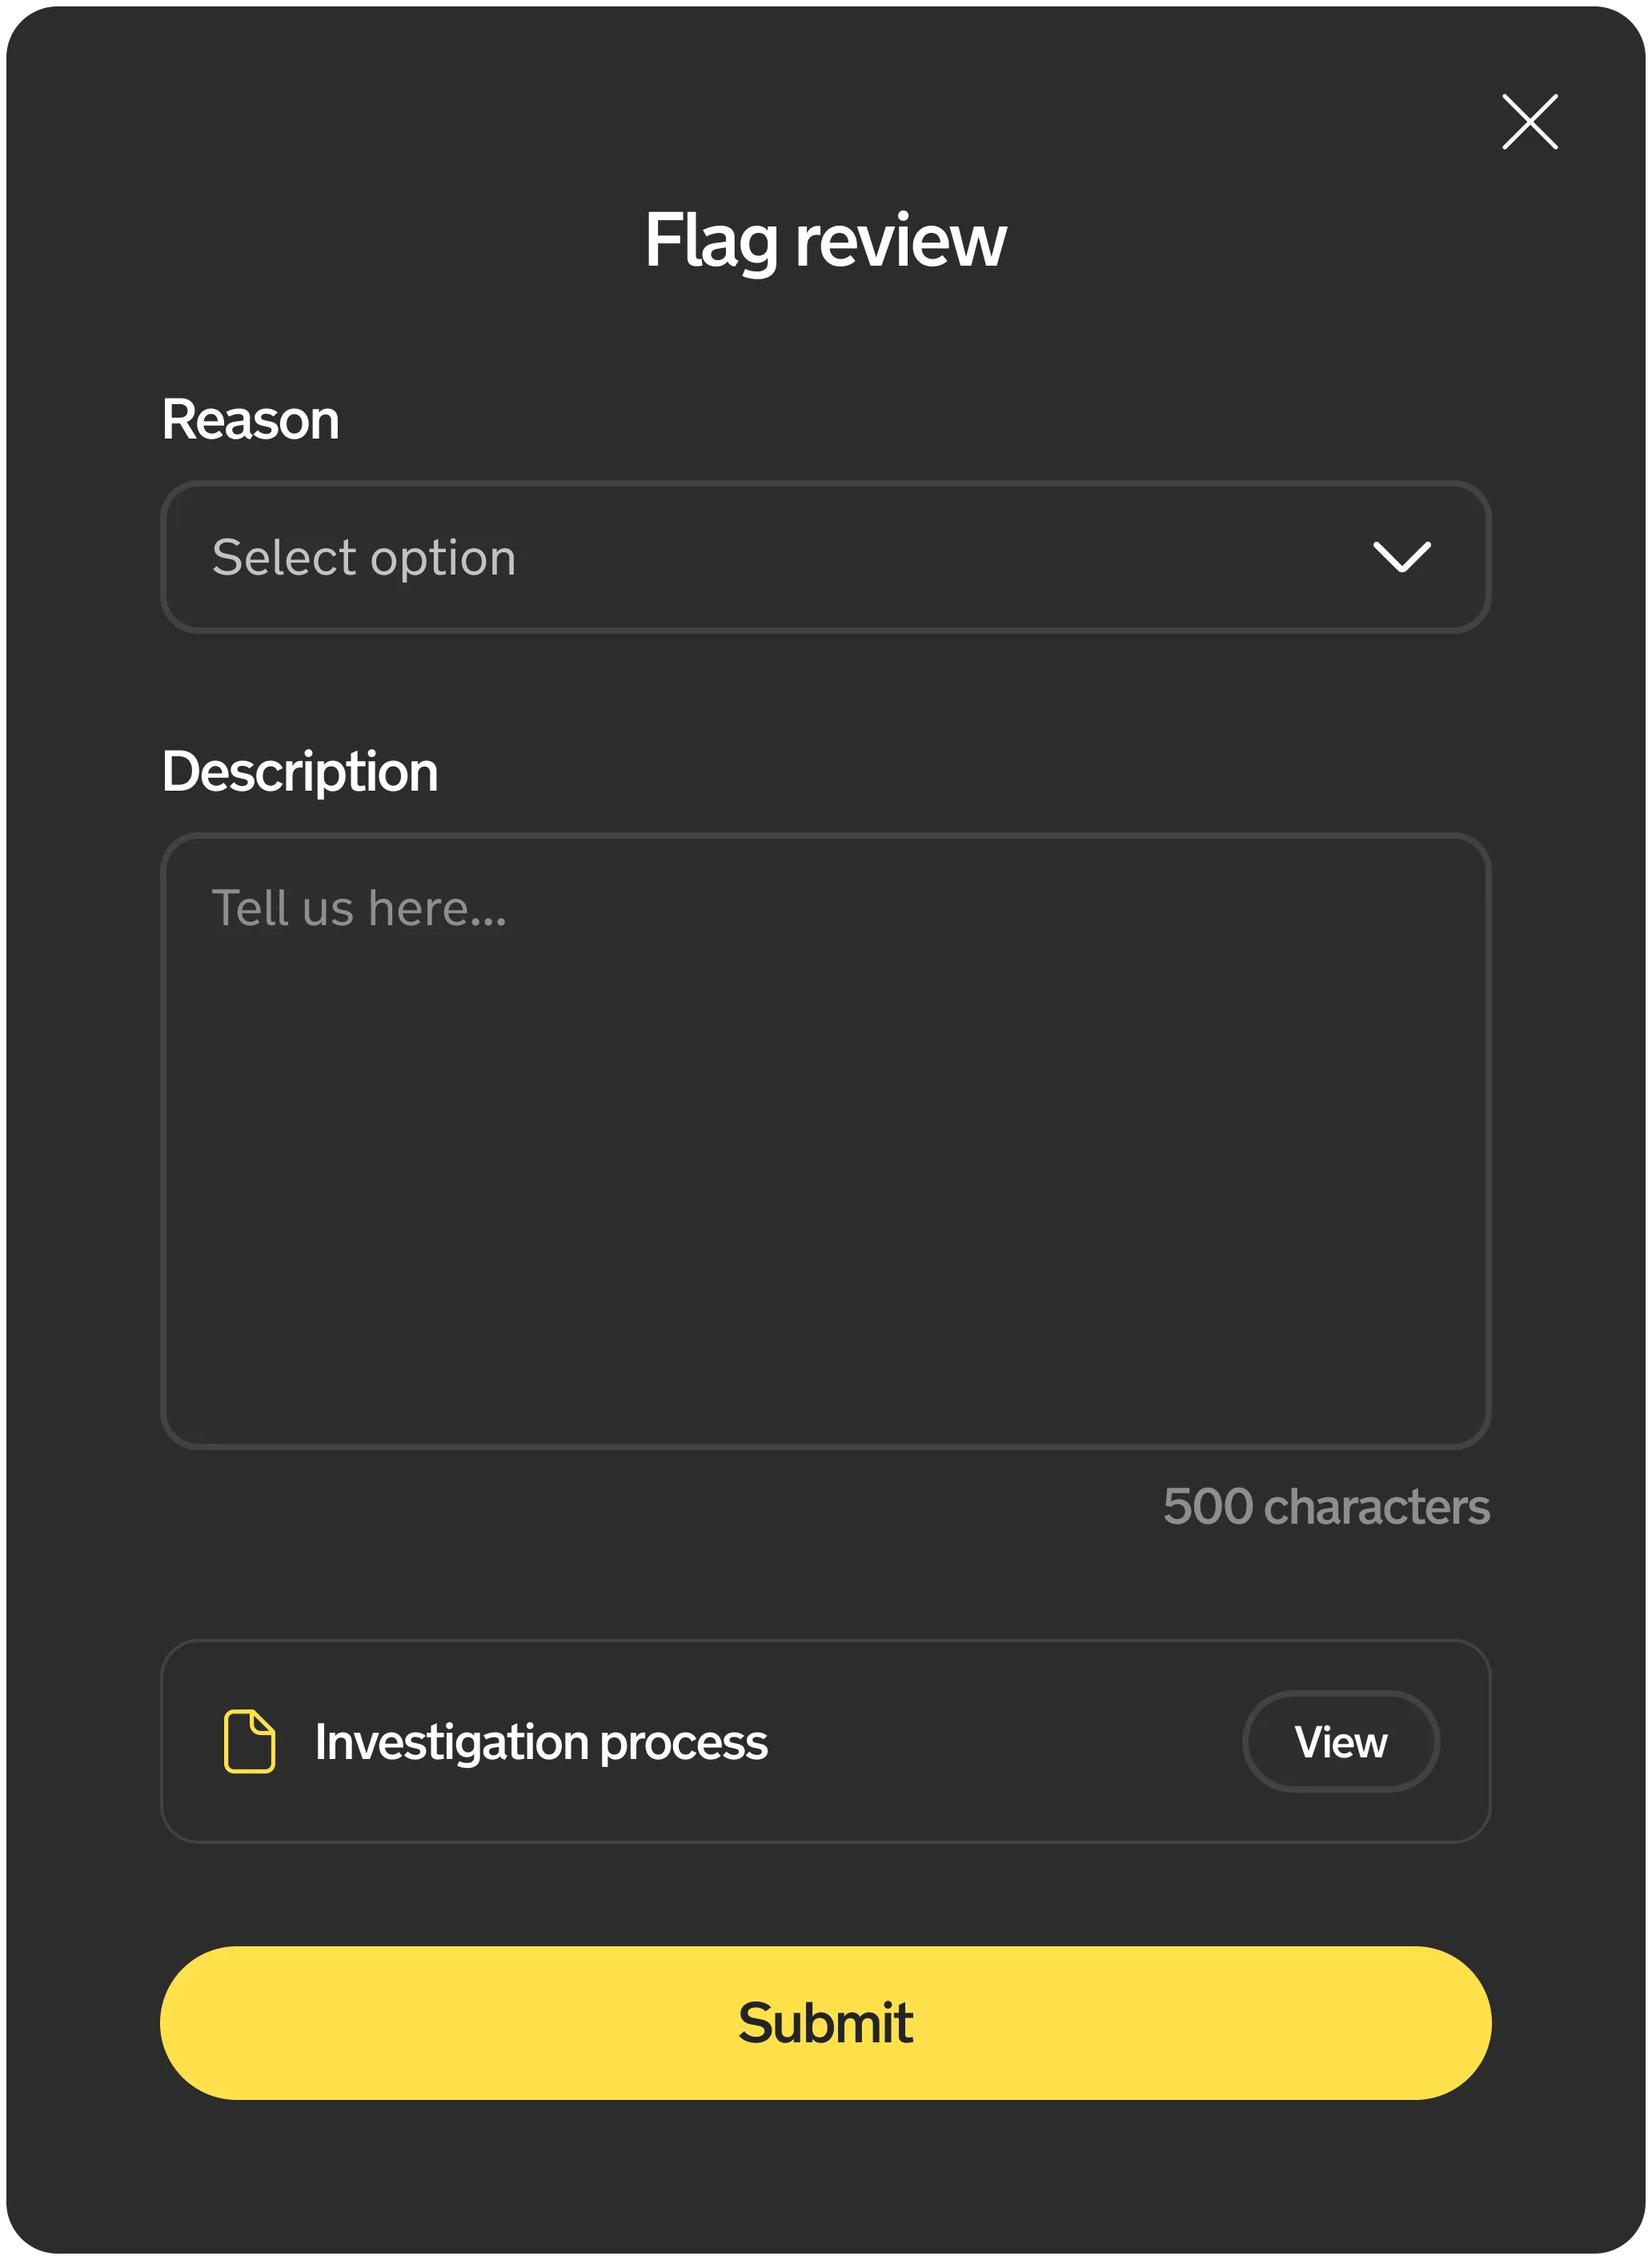
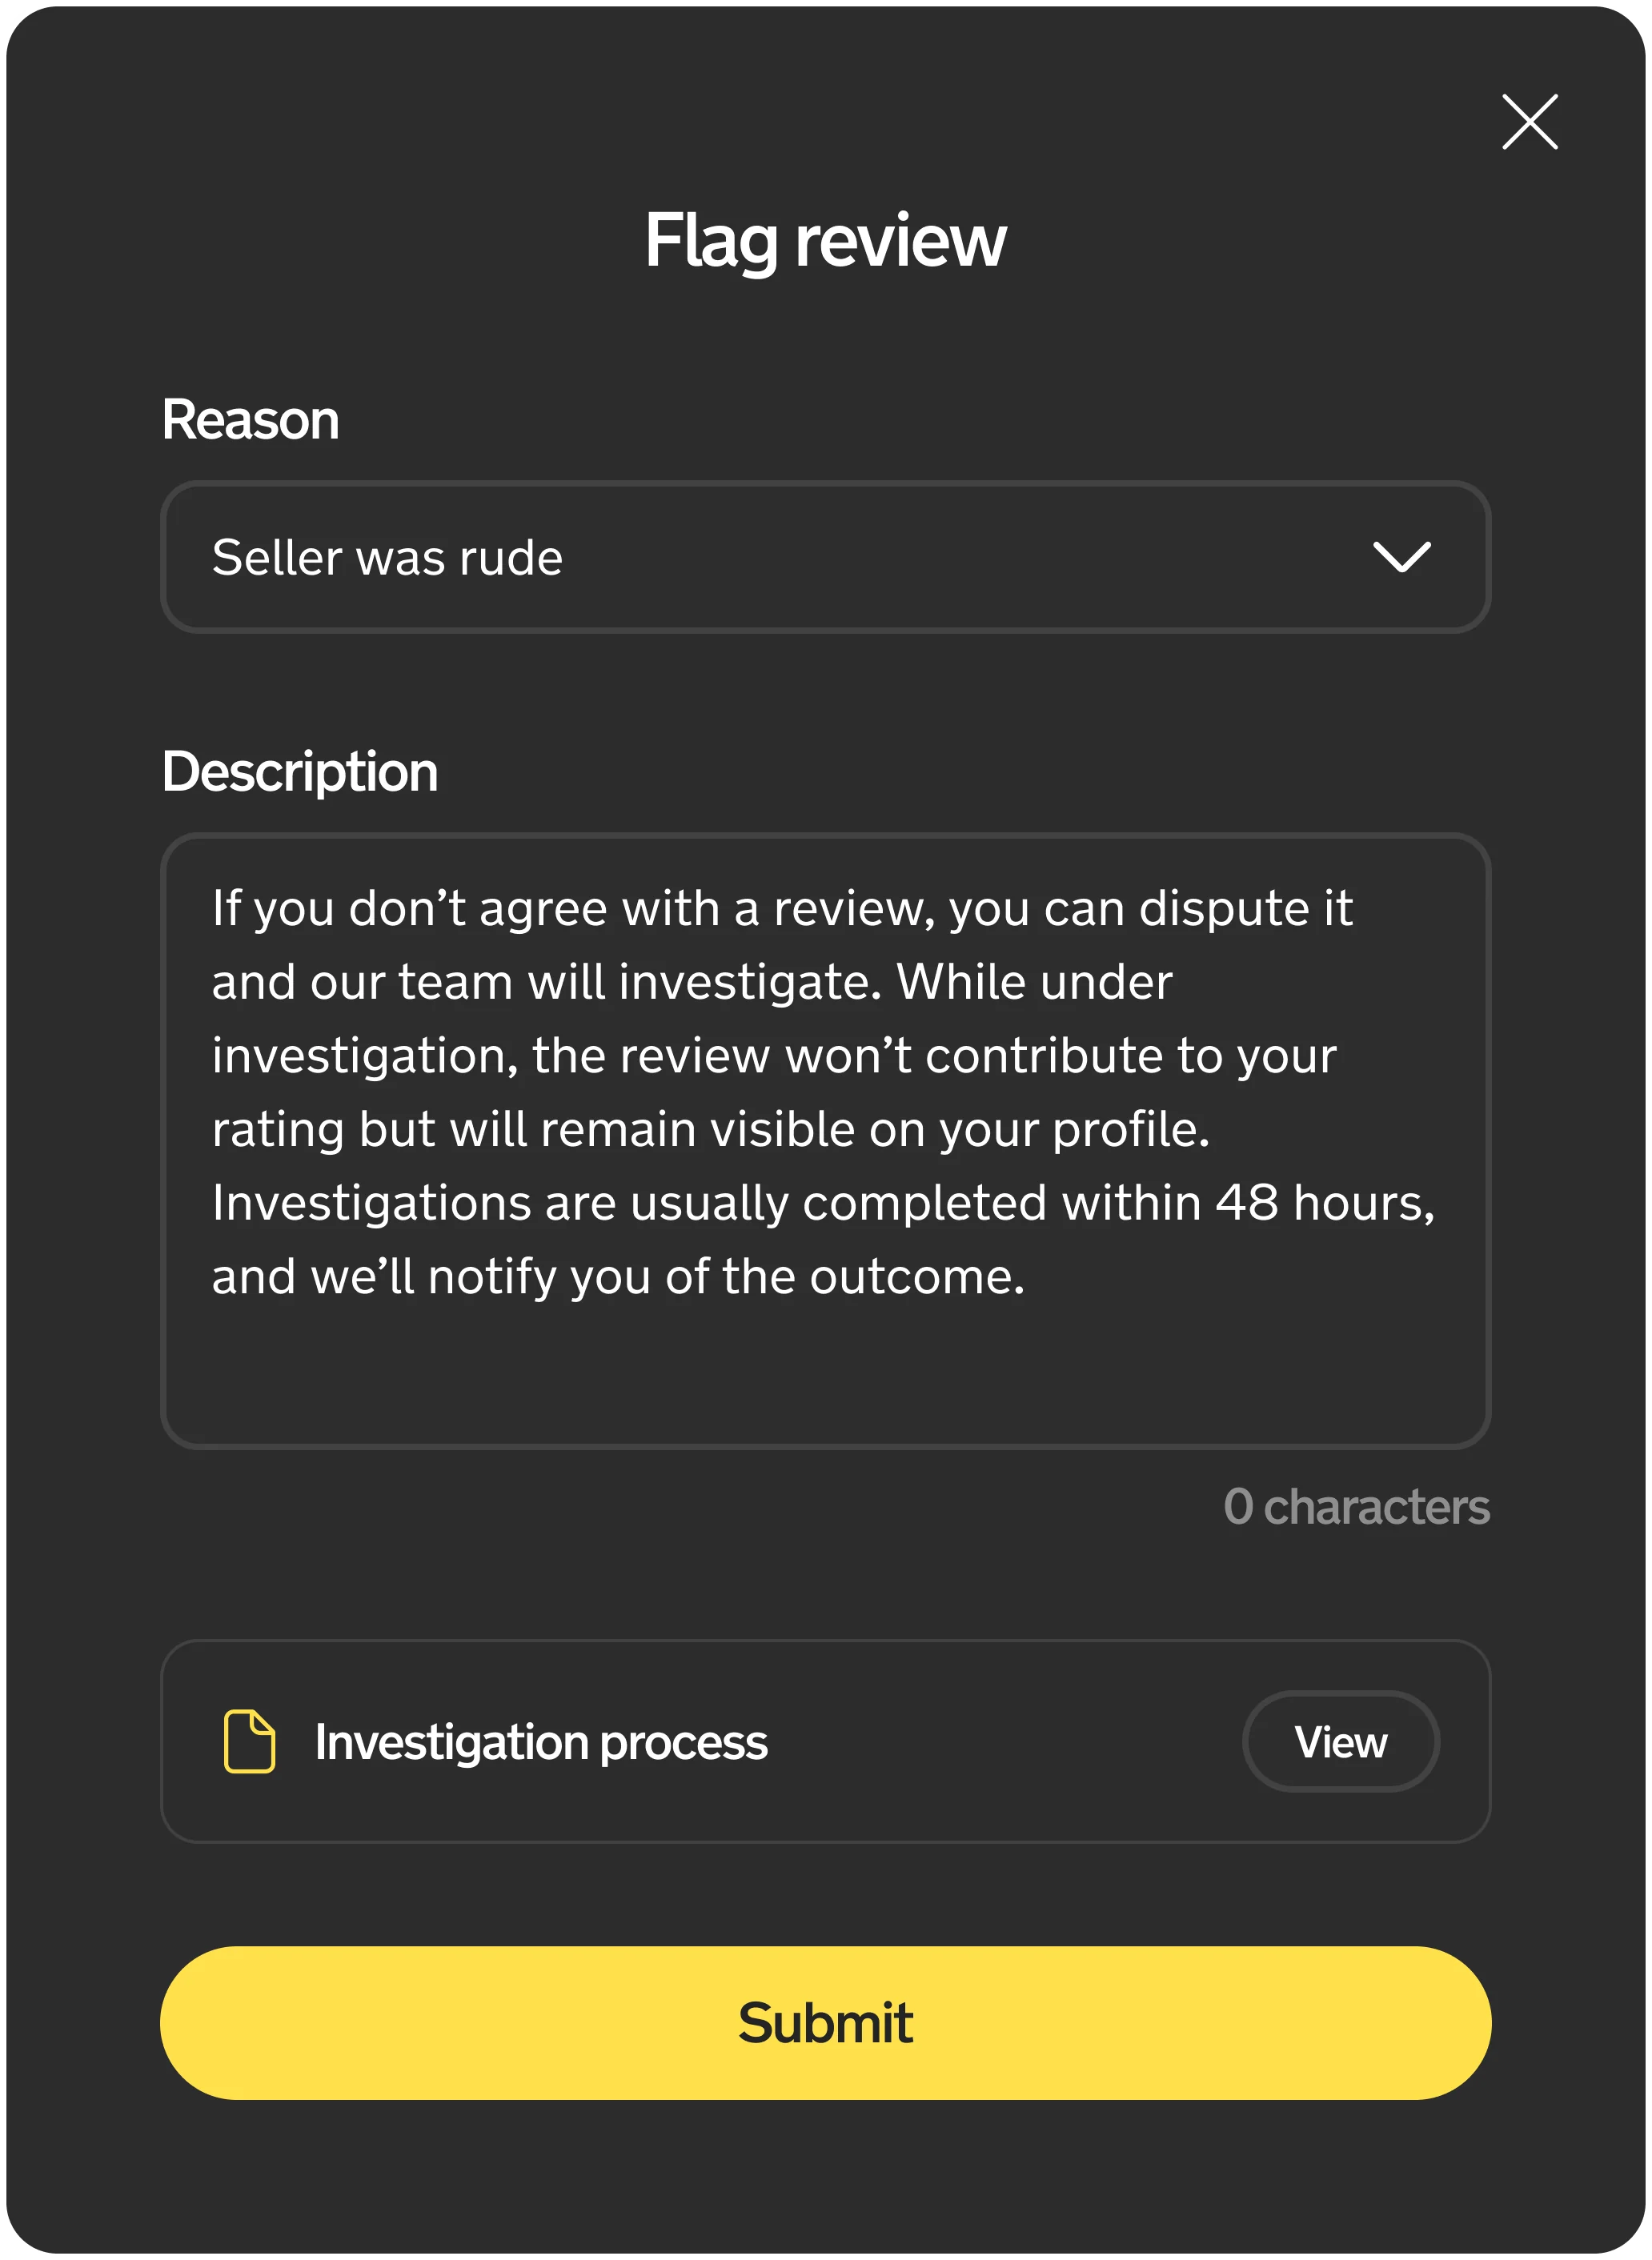
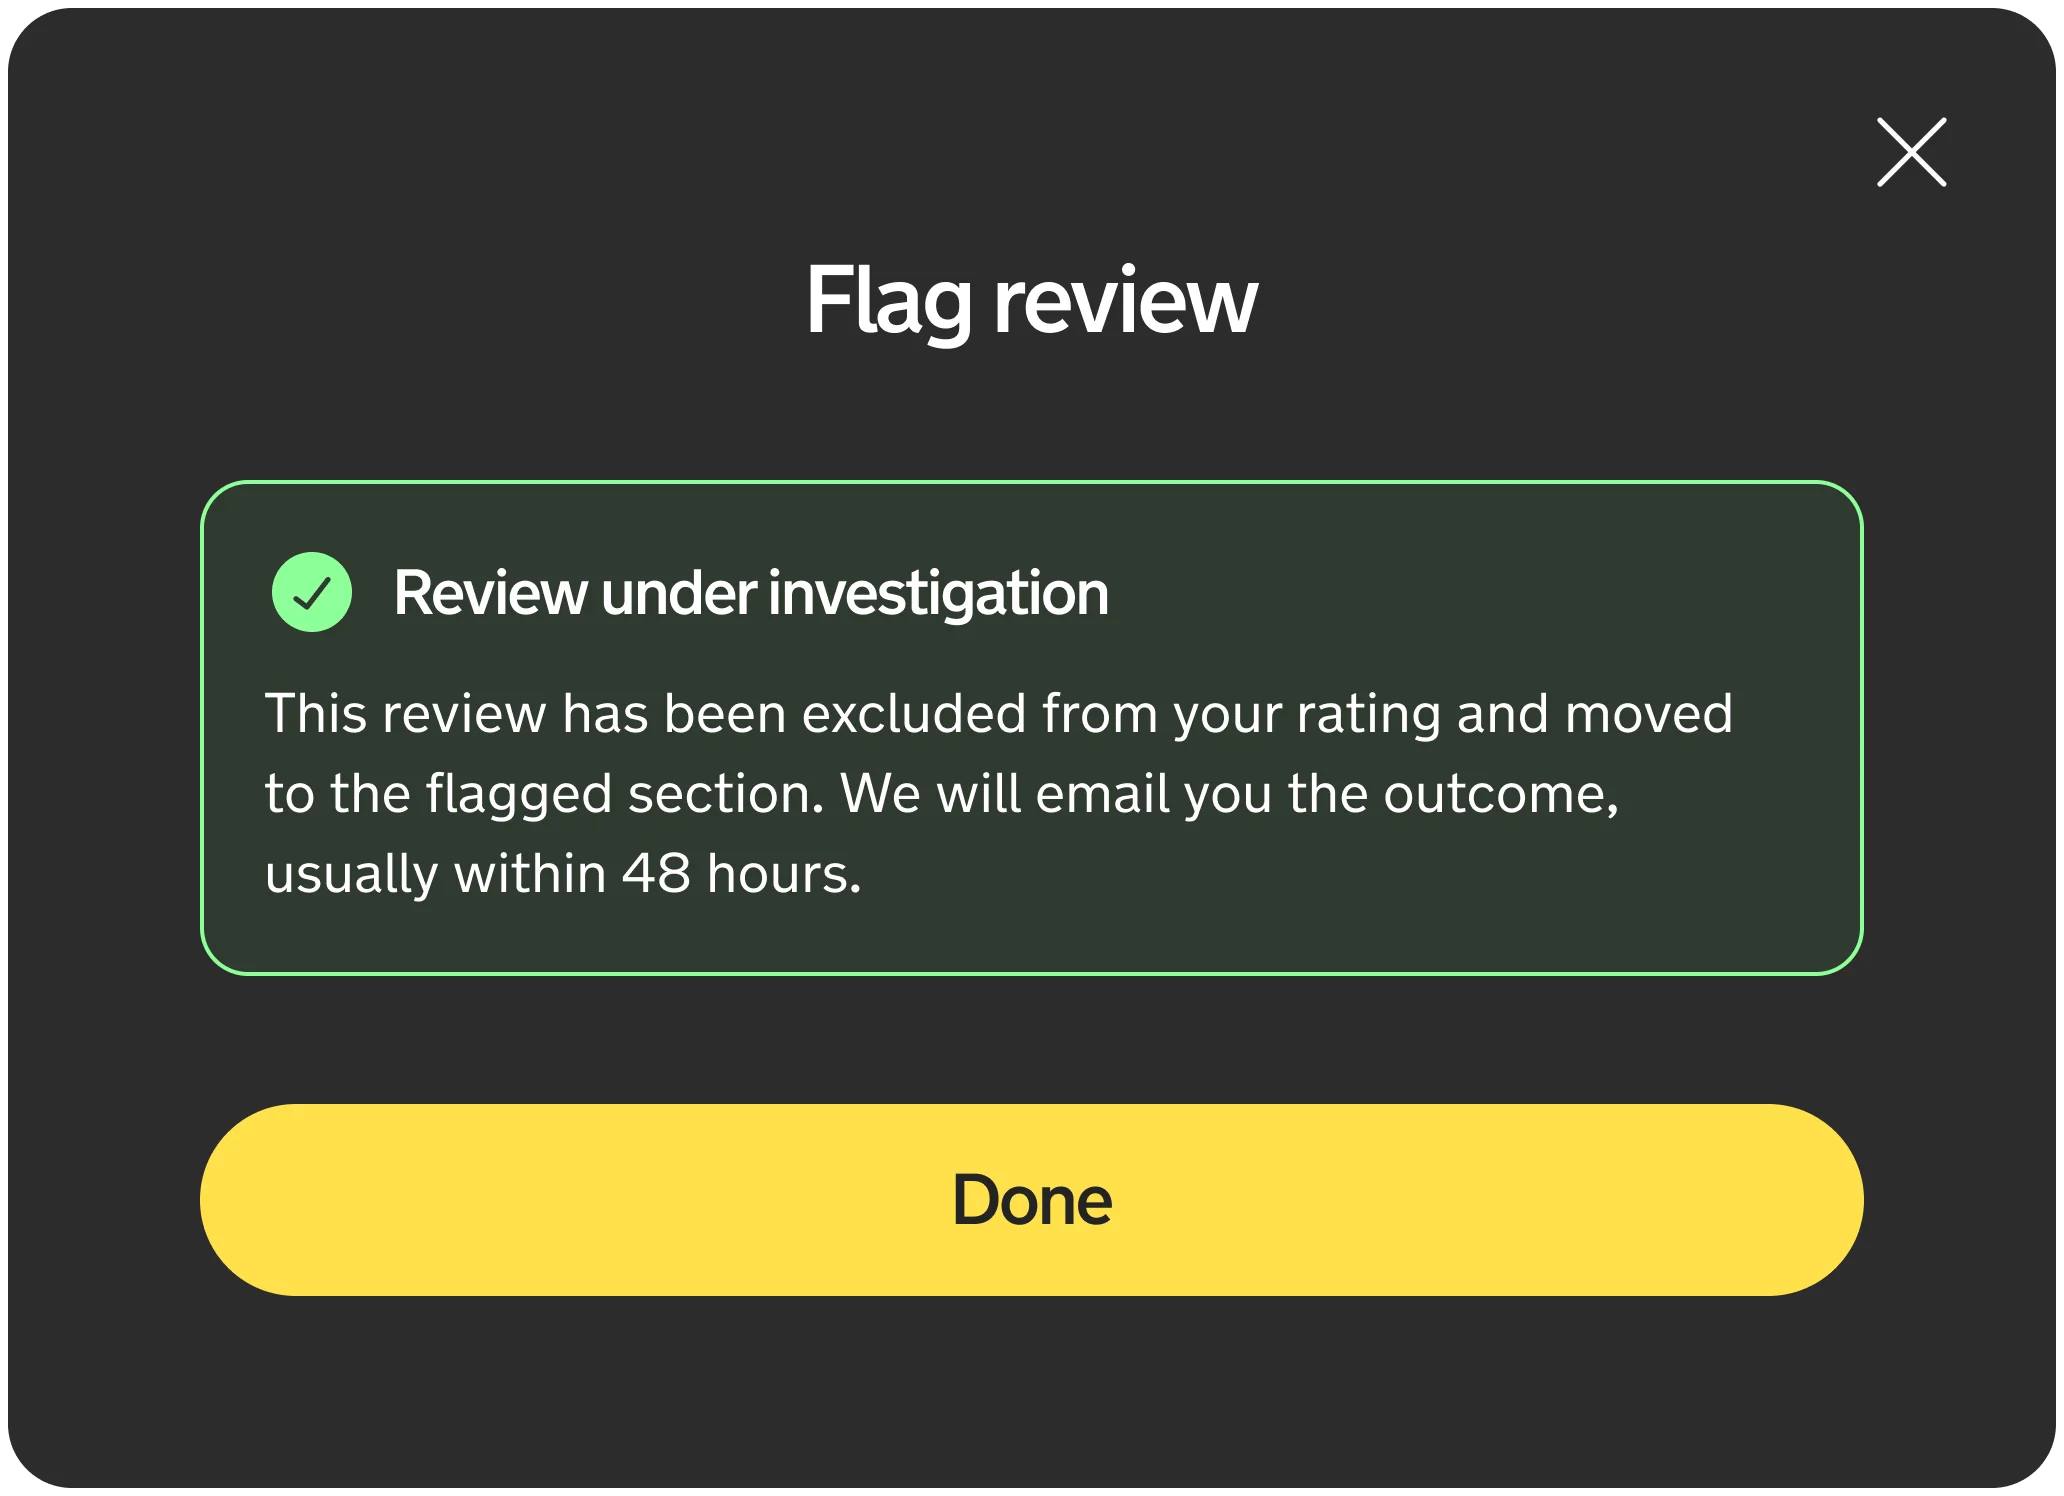
Reviews need to be visible enough to change behaviour and credible enough that both sides trust them. So dealers can flag a review they believe is unfair; it's investigated and excluded from their rating until resolved. New reviews also have a 24-hour grace period before they count.
05. Test with real dealers
We tested the dashboard with dealers across performance, cancellations and a proposed bid target calculator. The first two tested well; the calculator got a mixed response, a useful reminder to check whether a feature helps rather than assume more information is always better.
Iteration & delivery
Building, testing and rolling out in phases.
The less visible challenge was the data. Every metric needed a clear definition, had to match other dealer-facing numbers and be anchored to consistent dates, and surfacing it reliably depended on the Data team. A dashboard is only as useful as the data behind it.
Reviews brought a different challenge: introducing transparency gradually. Rolling out in phases let us see how dealers responded and understand what allowing challenges would mean operationally, giving dealers meaningful feedback without creating an unmanageable queue of disputes.
Exploring Top Dealer
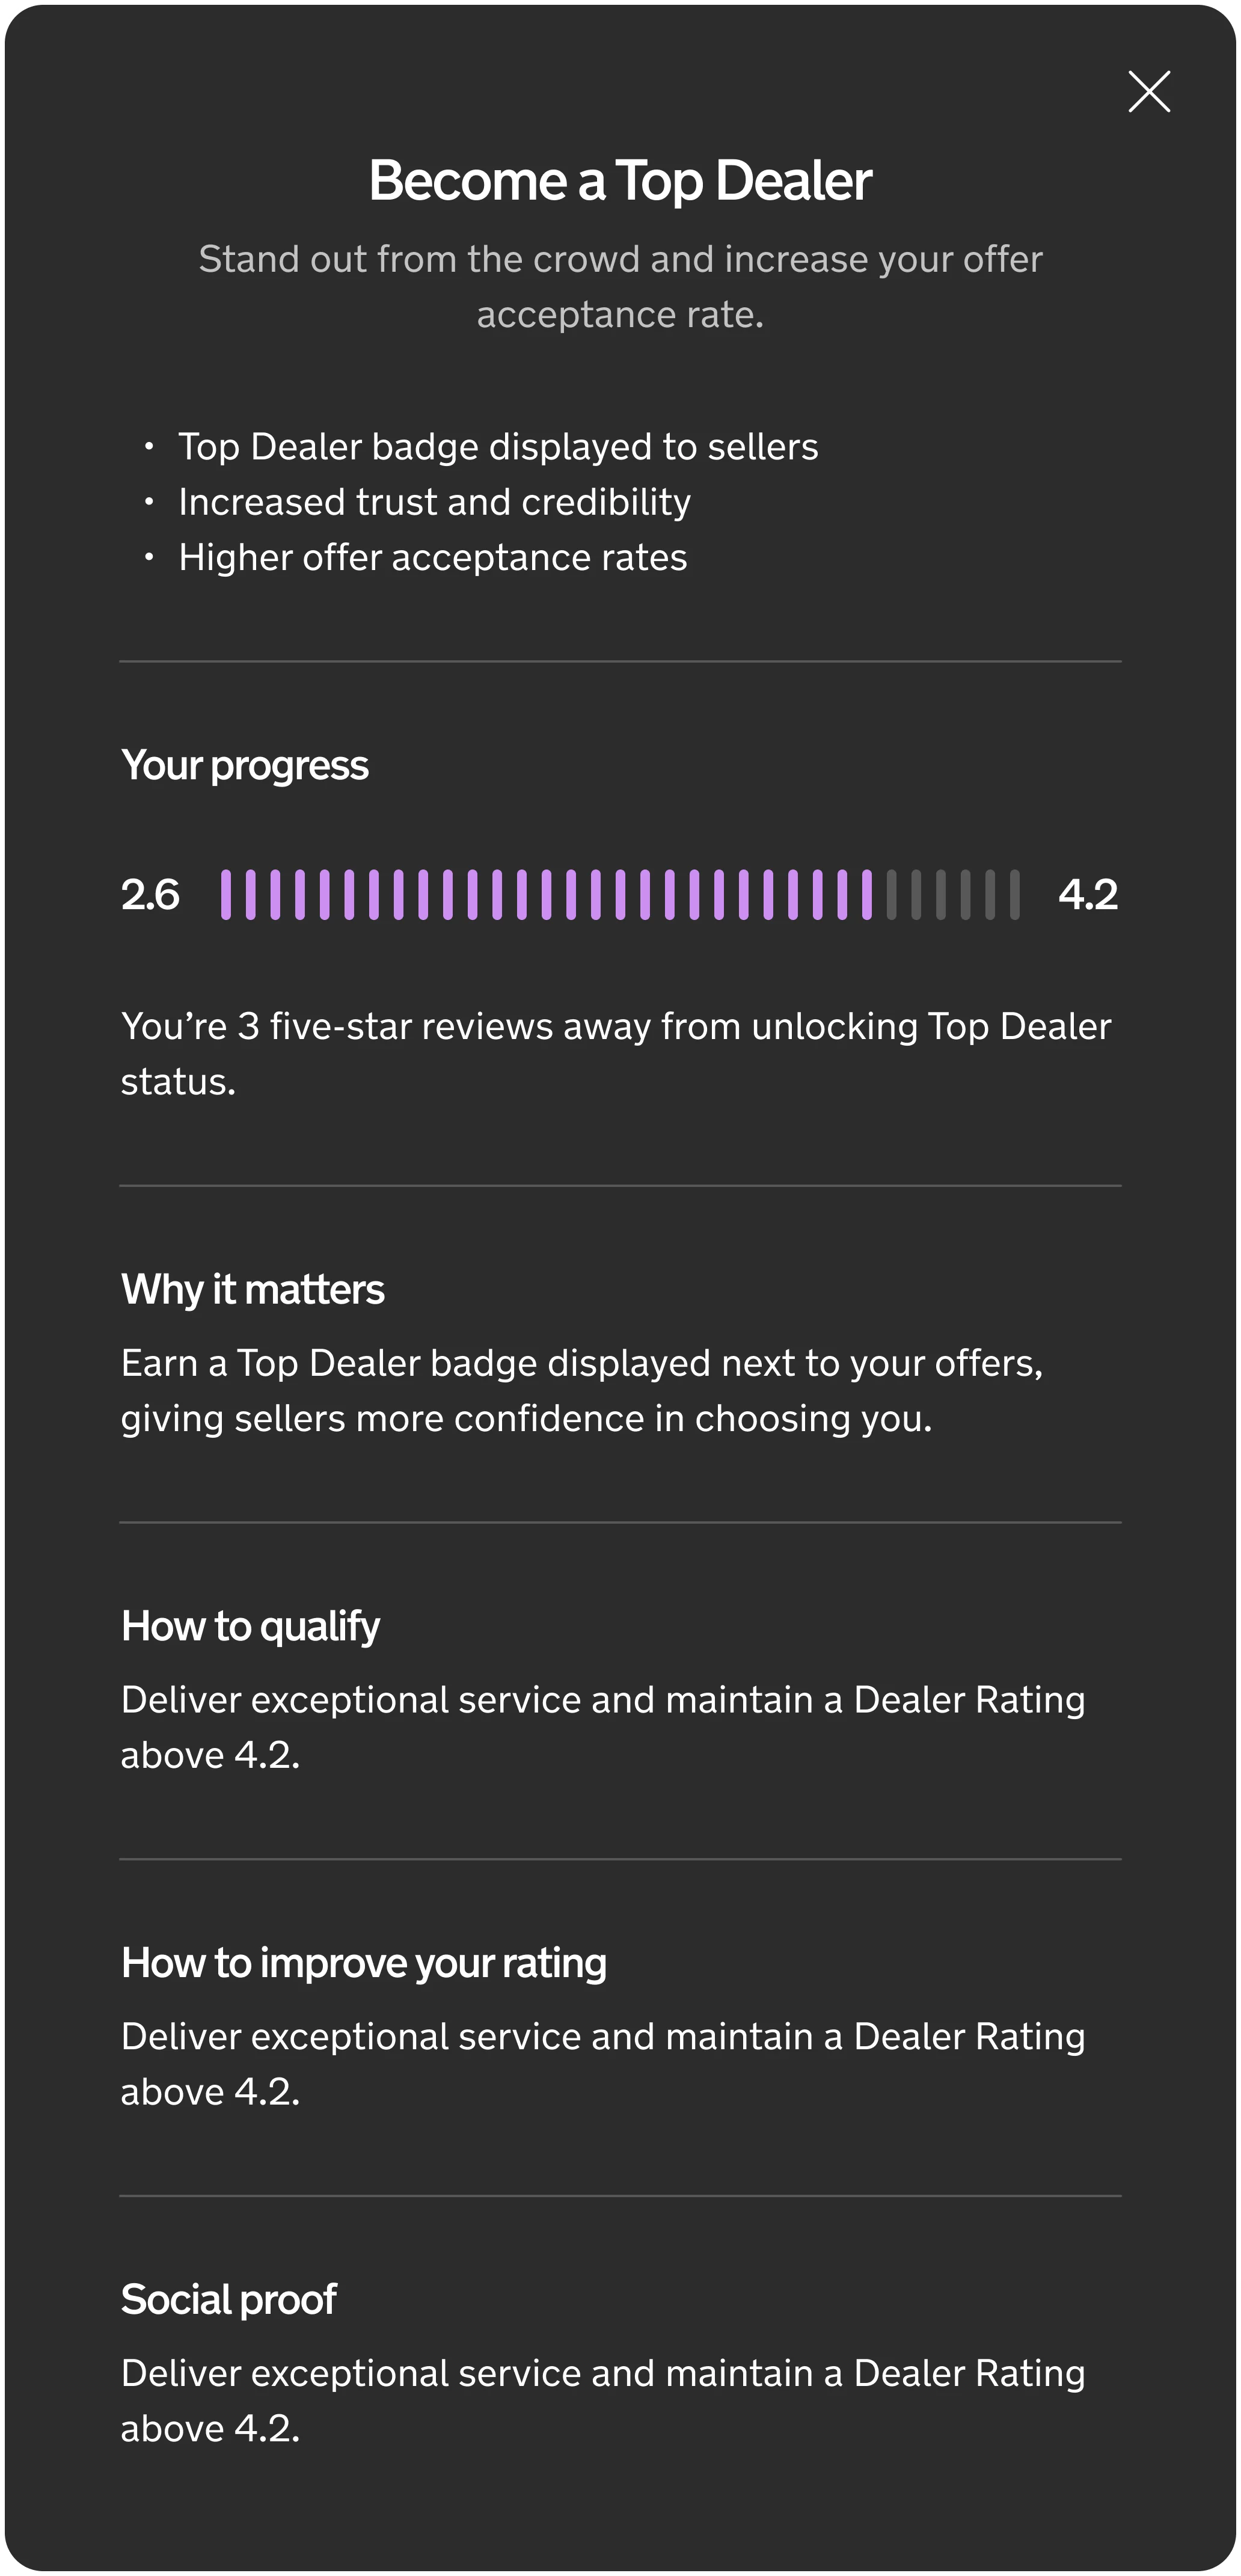
Alongside the reviews launch, we explored a way to reward dealers with consistently high scores. Dealers would see their progress towards Top Dealer and earn a badge shown to sellers alongside their offers, turning reputation from something to protect into something worth working towards.
Outcomes & learnings
A foundation for better dealer decisions, and a fairer marketplace.
The dashboard gave dealers one place to see their bidding, spending and cancellations for the first time, and became part of how many of them run their business on Motorway. Dealer Reviews launched in Q3 2026, giving dealers visibility of their reputation for the first time.
In numbers
- 55%
- Of monthly active dealers used the dashboard
- Counting every dealer who viewed at least one car on Motorway that month.
- 14,000+
- Reviews
- Seller feedback collected across more than 2,350 dealers by January 2026.
- 4.4 out of 5
- Average dealer rating
- In the review data at that point.
The next step is to connect visibility to outcomes: moving the dashboard from reporting what happened to pointing out what needs attention, and testing whether showing dealer quality to sellers changes which offers they accept. Those are still hypotheses to validate, not results.
What I took away
Designing data-heavy products is as much about prioritisation and interpretation as visual design. A dashboard can have all the right metrics and still fall short if people don't understand what they mean, and a rating means little unless people trust the rules behind it.
The hardest part was balancing transparency with fairness, and thinking through how a change in one part of the marketplace could shift behaviour elsewhere.